Energy
The energy sector, which consists of all the activities involved in the production, transformation, and sale of energy, including the petroleum, gas, electricity, coal, nuclear power, and renewable energy industries, is one of the main drivers of socio-economic development. In other words, hydrocarbon resources play an important role in the development and economic growth of countries with large reserves of oil and gas, alongside the rising importance of renewable sources and the increasing efforts to implement the Paris Agreement.[1]
The Arab region is one of the world’s richest regions in terms of oil and natural gas resources. Given that 80.4 percent of the world’s oil reserves are located in OPEC member countries, it is estimated at the end of 2021 that around 55.2 percent of the world’s proven oil reserves are located in the six Arab member states of OPEC, with additional 11 out of the 22 Arab countries holding proven oil reserves. Saudi Arabia held the second largest proven oil reserves in the World with 267.19 billion barrels, followed regionally by Iraq and UAE at 145.02 and 111 billion barrels, respectively.[2] In addition, 26 percent of the world’s proven natural gas reserves are located in the Arab region, with Qatar having the third largest reserves in the world at 24.7 trillion cubic meters in 2020.[3]
The existence of large oil and gas reserves impacts the production of energy products that amounted to a total of 1.815 billion tonnes of oil equivalent (toe) in the Arab region in 2020.[3][4] The energy consumption reached 459.3 million toe in 2020, with the GCC countries consuming 60.5 percent of the supplied energy. It is noteworthy to mention that the most energy-consuming sector in the region is transport at 28.02 percent, followed by industry at 27.1 percent and households at 16.2 percent. The abundance of hydrocarbon resources and the high production rates make the Arab region a large exporter of energy products, with 68.2 percent of the energy produced being exported.[4]
Crude oil production amounted to 1.305 billion toe in the Arab region in 2020 with Saudi Arabia producing 527.7 million toe. Out of the crude oil and oil products produced in the Arab region, 82.1 percent were exported in 2020,[4] On the consumption side, the average oil products consumption per capita amounted to 571 Kilogram of oil equivalent (kgoe) for the whole region and 2444 kgoe for the Gulf region, compared to the World average of 469 kgoe per capita in 2020.[4] The transport sector was the most oil-consuming sector in the Arab region at 52.9 percent, followed by the industry sector (10 percent) and households (7.38 percent).[4]
Globally, 14.58 percent of the World's natural gas production and 16.18 percent of the World's natural gas exports derived from the Arab region in 2020. Natural gas production in the Arab region amounted to 484.61 million toe in 2020, with Qatar producing 148.38 million toe, followed regionally by Saudi Arabia and Algeria at around 80.69 million toe and 72.13 million toe respectively. Out of the total production in the Arab region, 34.37 percent of the natural gas was exported. On the consumption side, 117.72 million toe were consumed in the Arab region in 2020, with the industrial sector consuming 65.13 percent of the total natural gas supplied, followed by the households sector at 10.08 percent.[4]
Electricity production in the region relies heavily on conventional fuel sources, with a production amounting to 1.257 Million GWh in 2020. The consumption of electricity amounted to 77.9 percent of the total electricity produced in 2020, reaching 980 Thousand GWh.
At the sectoral level, 42.9 percent of electricity was consumed by households, followed by commerce and public services at 26.58 percent, and industry at 21.5 percent.[4] On the other hand, the electrification rate in 14 Arab countries was above the World average of 91.4 percent in 2021, with 11 countries reaching 100 percent electrification rate. Mauritania and Somalia have electrification rates of 47.69 and 49.32 percent respectively.[5] In 2017, GCC members had an installed power capacity of 146 GW, yet renewables’ share of production was less than 1 percent.[6] Even though Kuwait was an early adopter of solar power in the 1970s and 1980s, the UAE is by far the regional leader in terms of installed renewable energy capacity. However, Saudi Arabia's renewable power target, for example, is planned to be 50% of generation by 2030 while UAE's target is 44 percent by 2050 and Oman at 30 percent by 2030.[7]
Given the high economic impact of energy subsidies on national economies, the international drop in the prices of petroleum products, and the aspirations of some countries to drive green solutions forward, some Arab countries are phasing out energy subsidies. However, in 2022, fossil fuel subsidies as a percentage of GDP is still above 10 percent in 9 countries of which 4 GCC countries ranging from 11.9 percent in Sudan to 21.5 and 29.8 percent in Saudi Arabia and Libya.[8]
This overview was last updated by the ADP team based on latest available data as of August 2023.
Sources:
[1] United Nations Climate Change. The Paris Agreement. [ONLINE] Available at: http://unfccc.int/paris_agreement/items/9485.php [Accessed 16 November 2020].
[2] Organization of the Petroleum Exporting Countries (OPEC). 2023. Data/Graphs. [ONLINE] Available at: https://www.opec.org/opec_web/en/data_graphs/330.htm [Accessed 15 August 2023].
[3] British Petroleum. Statistical Review of World Energy 2021. [ONLINE] Available at: https://www.bp.com/content/dam/bp/business-sites/en/global/corporate/pdfs/energy-economics/statistical-review/bp-stats-review-2021-natural-gas.pdf [Accessed 15 August 2023].
[4] ADP calculations based on data extracted from the International Energy Agency. Energy balances. [ONLINE] Available at: https://www.iea.org/data-and-statistics/data-tools/energy-statistics-data-browser?country=WORLD&fuel=Energy%20supply&indicator=TESbySource [Accessed 15 August 2023]. And from the Population Division of the Department of Economic and Social Affairs of the United Nations Secretariat. World Population Prospects 2022. [ONLINE] Available at:
https://population.un.org/wpp/Download/Standard/Population/ [Accessed 09 August 2023].
[5] The World Bank. 2023. World Development Indicators. [ONLINE] Available at: https://databank.worldbank.org/data/reports.aspx?source=world-development-indicators [Accessed 08 August 2023].
[6] International Renewable Energy Agency. 2019. Renewable Energy Market Analysis. [ONLINE]. Available at: https://www.irena.org/-/media/Files/IRENA/Agency/Publication/2019/Jan/IRENA_Market_Analysis_GCC_2019.pdf [Accessed 16 November 2020].
[7] Middle East Institute. 2022. Renewable power policies in the Arab Gulf states. [ONLINE]. Available at: https://www.mei.edu/publications/renewable-power-policies-arab-gulf-states [Accessed 16 August 2023].
[8] International Monetary Fund. 2023. Fossil Fuel Subsidy Database. [ONLINE]. Available at: https://www.imf.org/-/media/Files/Topics/Environment/energy-subsidies/fuel-subsidies-template-2022.ashx [Accessed 16 August 2023].
Data Highlights
-
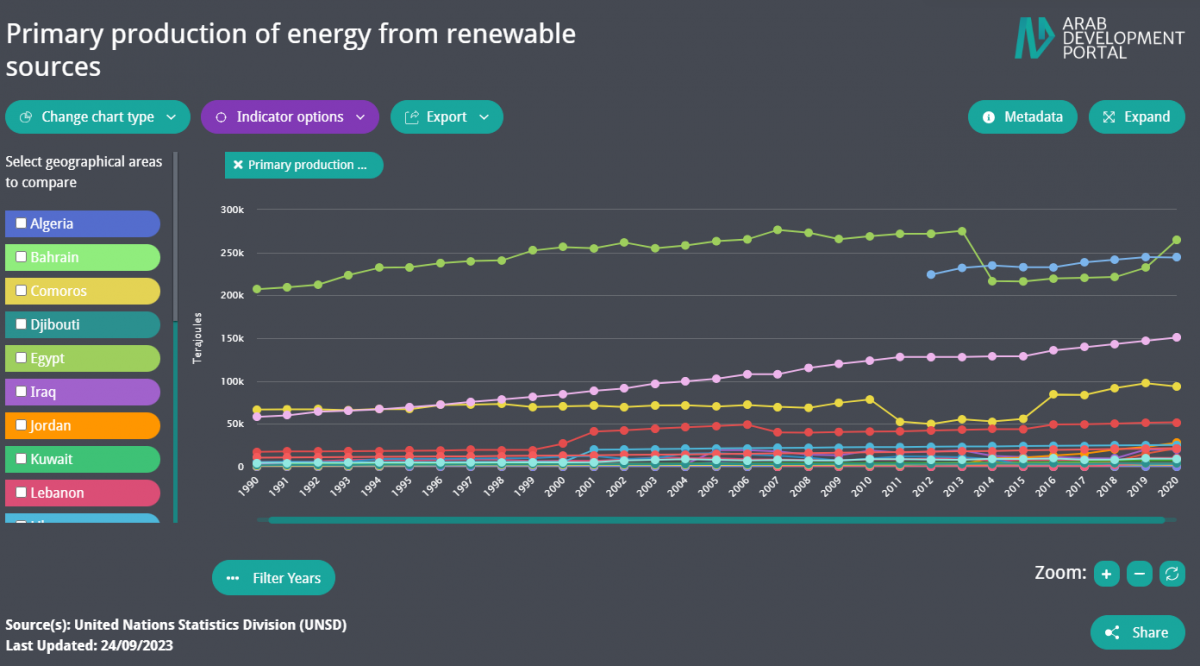
Egypt scored the highest primary production of energy from renewable sources in the Arab region.

Resources
-
Energy Efficiency and Renewable Energy Strategies and Policies
 Mitigation Enabling Energy Transition in the MEDiterranean region and Regional Center for Renewable Energy and Energy Efficiency, RCREEE Energy Efficiency and Renewable Energy Strategies and Policies 2020This report provides an overview of the current energy efficiency and renewable energy strategies and policies, including regulatory frameworks and a summary of the principal challenges encountered in the promotion of EE and RE projects. Read More
Report -
Arab Future Energy Index (AFEX) 2019
 Regional Center for Renewable Energy and Energy Efficiency (RCREEE) and United Nations Development Programme (UNDP) Arab Future Energy Index (AFEX) 2019 2019The AFEX 2019 - Renewable Energy edition reveals how energy systems in the Arab region are moving towards becoming more sustainable and resilient. Simply, the renewable energy (RE) business is in ascendance. The region-wide developments prove the robust commitment of...Read More
Report -
Tracking SDG 7: Energy Progress Report Arab Region
 United Nations Economic and Social Commission for Western Asia Tracking SDG 7: Energy Progress Report Arab Region 2019This publication aims to help build capacity in the Arab region, through access to information, with the aim of strengthening proactive policy to improve energy security, enhance resilience in the face of climate change and mainstream sustainable development goals into...Read More
Report -
Statistical Yearbook 2019 - Industry and Energy
 Central Agency for Public Mobilization and Statistics Statistical Yearbook 2019 - Industry and Energy 2019This section includes data on industrial Statistics at Level of production, No. of establishments, generated electric energy and its distribution, general index of Manufactures production and building and construction indicators in different sectors. The first...Read More
Government publication